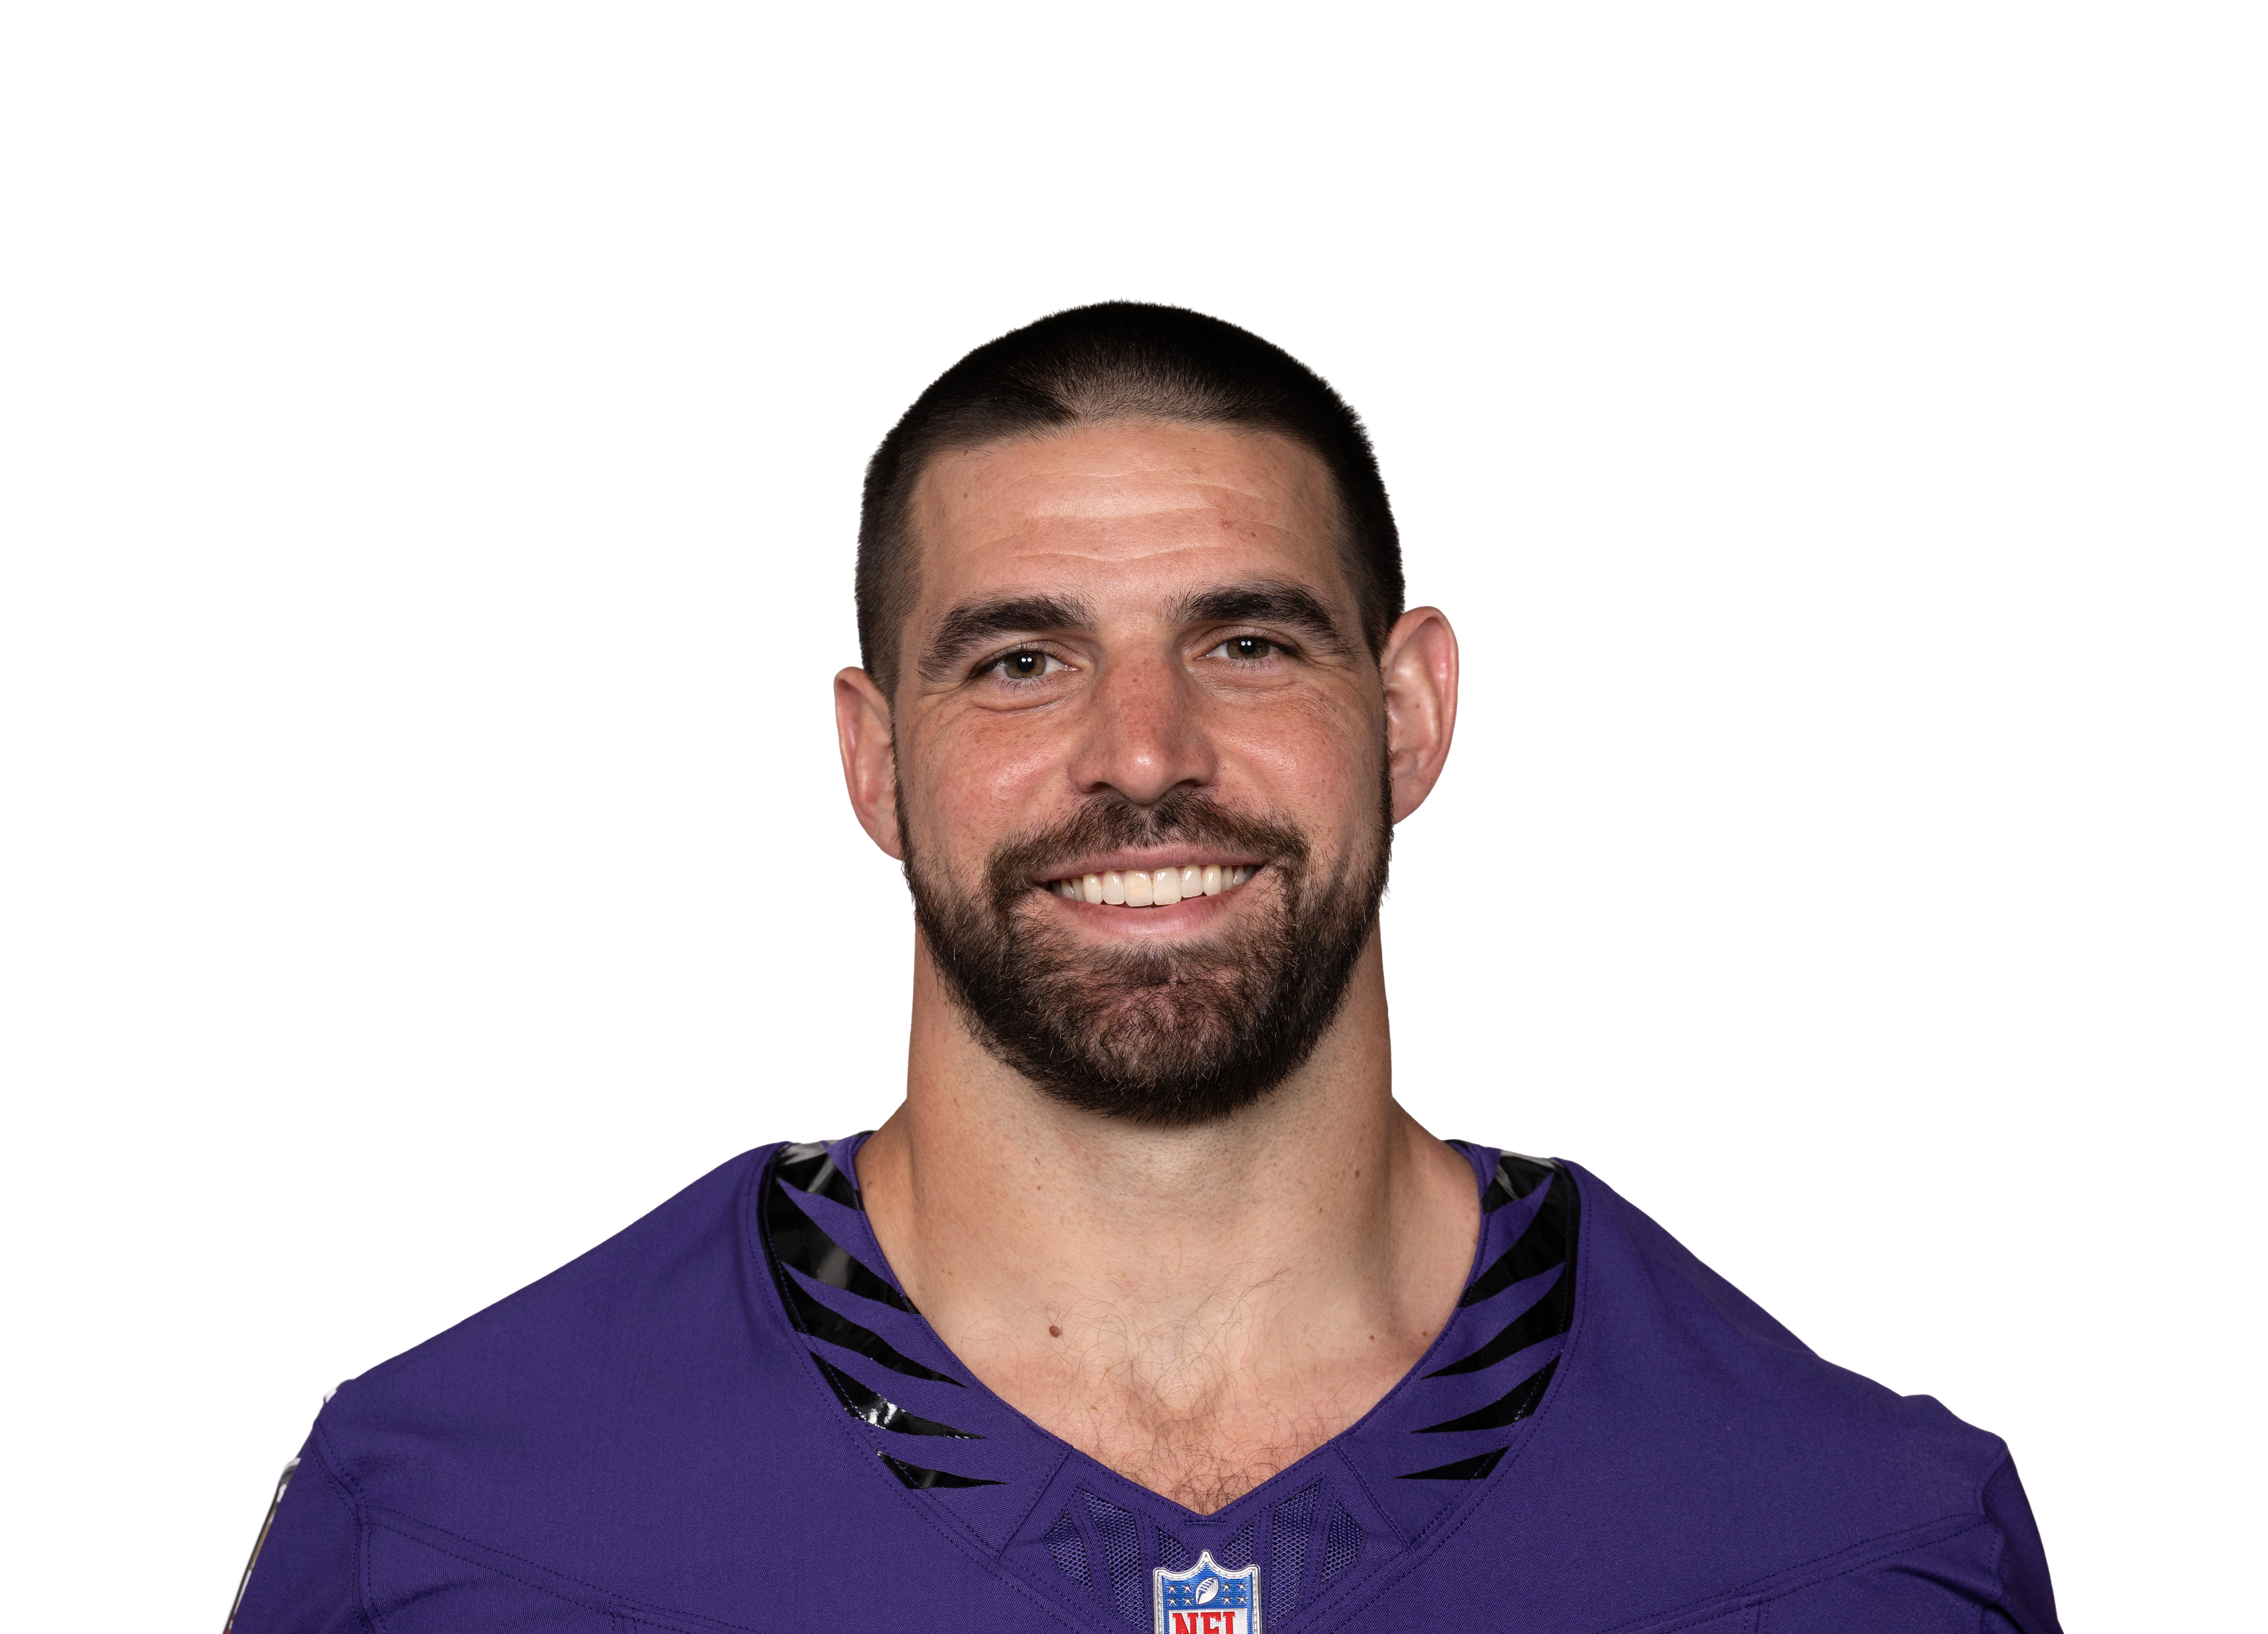
Mark Andrews
TE ·  Ravens · Oklahoma · 2018 round 3, pick 86
Ravens · Oklahoma · 2018 round 3, pick 862026 PPR
8.9
8.90 per game over 1
2026 projection
92.7
TE6 · overall 59
Red zone touches
1
0 touchdowns
Snap share
72.0%
offensive snaps
2026 production
Receptions4 of 6
Receiving yards49
Receiving TDs0
Target share25.0%
Red zone role
Targets inside the 201
Carries inside the 200
Touchdowns0
BAL red zone TD rate75.0%
BAL pass rate inside 2036.4%
Red zone volume is the part of a scoring role that carries between seasons; touchdowns themselves are far noisier than the usage that produced them.
Projection in all three formats
Formats are not rescalings of one another. Dropping the point per reception reorders the board, because a possession receiver’s value is mostly catches and a runner’s is mostly yards.
| Format | Proj | Per game | VOR | Overall | Pos |
|---|---|---|---|---|---|
| Full PPR | 92.7 | 7.73 | +16.0 | 59 | TE6 |
| Half PPR | 75.4 | 6.28 | +13.4 | 61 | TE6 |
| Standard | 58.0 | 4.83 | +9.3 | 72 | TE6 |
2026 PPR per game8.90
Weight on his own rate0.78
Age factor×0.95
Loading game log…
Loading career…